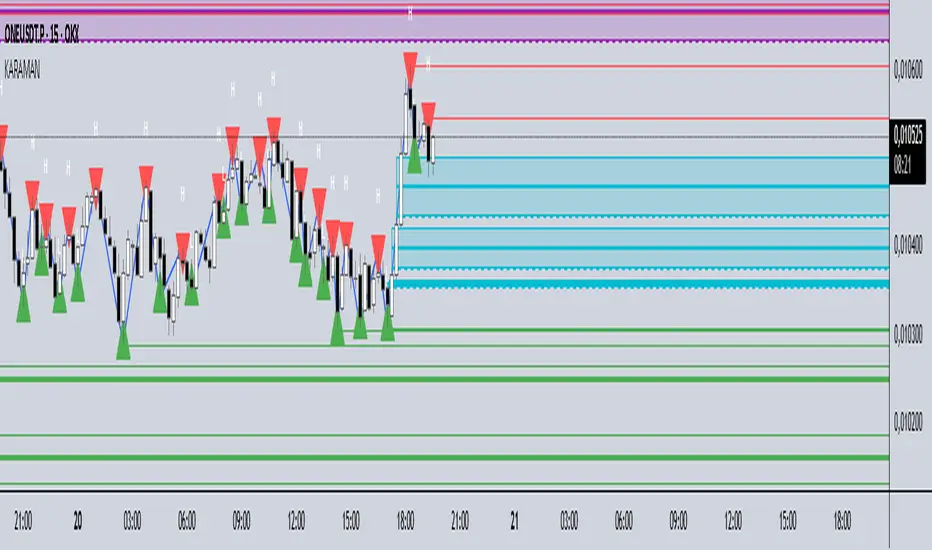
KARAMAN Swing High/LowThis Pine Script indicator detects and visualizes swing highs/lows, daily levels, and Fair Value Gaps (FVGs) with full customization:
Swing points:
Validated swings are shown as small triangles (red = high, green = low).
Optional rays extend from swing points, and a ZigZag line connects them.
Daily high/low:
Tracks daily extremes (UTC+3).
Draws right-extended rays from the previous day’s high/low.
Fair Value Gaps (FVGs):
Automatically detects bullish and bearish FVGs.
Draws boxes and three rays (top, middle, bottom).
When price touches the middle line, the box and two lines are deleted, leaving only the untouched boundary.
If price fully breaks the FVG, all elements are removed.
Settings panel:
Every element (swing candidates, valid swings, rays, ZigZag, daily levels, FVG boxes/rays) can be turned on or off.
Cari dalam skrip untuk "high low"
Previous Day High/Low Levels [OWI]📘 How to Use the “Previous Day High/Low Levels ” Indicator
This TradingView indicator automatically tracks and displays the previous day's high and low during the Regular Trading Hours (RTH) session. It’s perfect for traders who want to visualize key support/resistance levels from the prior day in futures like CME_MINI:NQ1! and COMEX:GC1! .
🛠 Setup Instructions
1. Customize RTH Session Times
- In the Settings panel, adjust the following under the Levels group:
- RTH Start Hour and RTH Start Minute: Default is 9:30 AM (New York time).
- RTH End Hour and RTH End Minute: Default is 4:15 PM.
- These define the active trading session used to calculate the day’s high and low.
2. Toggle Labels
- Use the Show PDH/PDL Labels checkbox to display or hide the “PDH” and “PDL” labels on the chart.
- Labels appear after the session ends and follow price dynamically.
📊 What the Indicator Does
- During the RTH session:
- Tracks the highest and lowest price of the day.
- After the session ends:
- Draws horizontal lines at the previous day’s high (green) and low (red).
- Optionally displays labels ("PDH" and "PDL") at those levels.
- Lines extend into the current day to help identify potential support/resistance zones.
✅ Best Practices
- Use this indicator on intraday timeframes (e.g., 5m, 15m, 1h) for best results.
- Combine with volume or price action analysis to confirm reactions at PDH/PDL levels.
- Adjust session times if trading non-US markets or custom hours.

Current Day High/Low and Mid- Made by IshaanThis TradingView indicator plots the current day's high, low, and mid (50%) levels, based on the daily timeframe, and displays them on any intraday chart (e.g., 15m, 1h, etc.).
Lines begin at the official market open time (default: 9:30 AM exchange time).
Lines extend right indefinitely so they’re visible throughout the day.
Values are updated live during the trading session using daily high and low data.
The mid line is calculated as the average of the current day’s high and low.
You can customize:
Line colors (high, low, mid)
Line thickness
Market open time
This tool is helpful for traders looking to monitor intraday interaction with key daily levels.

Range Progress TrackerRANGE PROGRESS TRACKER(RPT)
PURPOSE
This indicator helps traders visually and statistically understand how much of the typical price range (measured by ATR) has already been covered in the current period (Daily, Weekly, or Monthly). It includes key features to assist in trend exhaustion analysis, reversal spotting, and smart alerting.
CORE LOGIC
The indicator calculates the current range of the selected time frame (e.g., Daily), which is:
Current Range = High - Low
This is then compared to the ATR (Average True Range) of the same time frame, which represents the average price movement range over a defined period (default is 14).
The comparison is expressed as a percentage, calculated with this formula:
Range % = (Current Range / ATR) × 100
This percentage shows how much of the “average expected move” has already occurred.
WHY IT MATTERS
When the current range approaches or exceeds 100% of ATR, it means the price has already moved as much as it typically does in a full session.
This indicates a lower probability of continuing the trend with a new high or low, especially when the price is already near the session's high or low.
This setup can signal:
A possible consolidation phase
A reversal in trend
The market entering a corrective phase
SMART ALERTS
The indicator can alert you when:
A new high is made after the range percentage exceeds your set threshold.
A new low is made after the range percentage exceeds your set threshold.
You can adjust the Range % Alert Threshold in the settings to tailor it to your trading style.

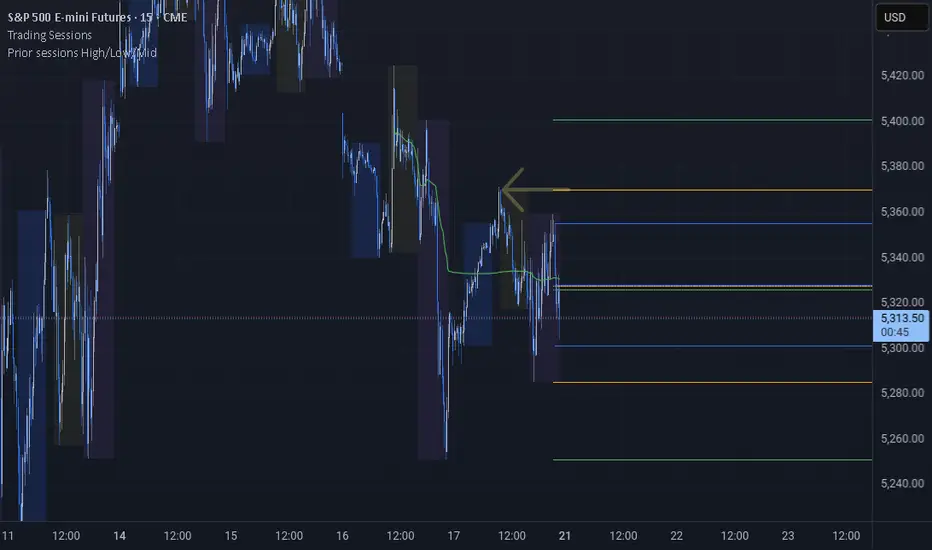
Prior sessions High/Low/MidThis indicator highlights the High, Low, and Midpoint of the most recently completed trading sessions. It helps traders visualize key price levels from the previous session that often act as support, resistance, or reaction zones.
It draws horizontal lines for the high and low of the last completed session, as well as the midpoint, which is calculated as the average of the high and low. These lines extend to the right side of the chart, remaining visible as reference levels throughout the day.
You can independently enable or disable the Tokyo, London, and New York sessions depending on your preferences. Each session has adjustable start and end times, as well as time zone settings, so you can align them accurately with your trading strategy.
This indicator is particularly useful for intraday and swing traders who use session-based levels to define market structure, bias, or areas of interest. Session highs and lows often align with institutional activity and can be key turning points in price action.
Please note that this script is designed to be used only on intraday timeframes such as 1-minute to 4-hour charts. It will not function on daily or higher timeframes.
Open Range Volatility (High/Low %)Overview
The Open-to-High/Low Movement Indicator helps traders visualize the percentage change between the opening price and the highest & lowest points of each trading session. This indicator is particularly useful for identifying intraday volatility, momentum strength, and potential reversals.
Key Features
✅ Real-Time High/Low Percentage Movement – Calculates and plots the percentage movement from the opening price to both the session high (green line) and session low (red line).
✅ Separate Chart Pane – Keeps your main price chart clean while displaying movements in a separate panel.
✅ Zero Reference Line – Helps distinguish upward and downward movements.
✅ +10% and -10% Threshold Lines – Assists in identifying significant price swings.
✅ Customizable & Lightweight – Efficiently tracks market movements without slowing down your chart.
How to Use
When the green line moves higher, it indicates strong buying pressure after the open.
When the red line moves lower, it shows selling pressure from the open price.
If movements stay within a small range, the market is experiencing low volatility.
Extreme movements beyond ±10% can indicate potential breakout or reversal zones.
Best for:
📈 Day traders tracking intraday momentum
📊 Swing traders spotting volatility trends
⚡ Scalpers identifying quick price movements
💡 Volatility-based strategies
This indicator works across all timeframes and asset classes, including stocks, forex, commodities, and crypto.
🚀 Add this to your chart today and stay ahead of the market!

Premarket High/Low Breakout AlertsPremarket High/Low Breakout Alerts
Description: This custom TradingView indicator helps you track premarket breakouts and breakdowns for a list of selected stocks. The indicator monitors the premarket session and sends an alert every time the stock's price breaks above the premarket high or below the premarket low.
Key Features:
Track Multiple Stocks: Easily monitor multiple stocks (e.g., AAPL, TSLA, NVDA, etc.) and get alerts when they break premarket levels.
Premarket Session Monitoring: The indicator checks for price movements during the premarket session (4:00 AM to 9:30 AM EST).
Customizable Ticker List: Modify the list of tickers directly from the TradingView settings to suit your daily trading needs.
Breakout and Breakdown Alerts: Receive instant alerts for both breakout (above premarket high) and breakdown (below premarket low) conditions.
Plot Premarket Levels: The premarket high and low levels are plotted on the chart for easy reference.
How to Use:
Add this indicator to your chart.
Go to the indicator settings and input your desired stock tickers (e.g., AAPL, TSLA, MSFT).
The indicator will automatically track the premarket levels and send alerts when those levels are broken.
Customize the tickers daily if needed.
Ideal For:
Day Traders who want to track premarket movements.
Swing Traders looking for strong breakouts from premarket levels.
Scalpers who need quick alerts to catch price action early.

First 12 Candles High/Low BreakoutThis indicator identifies potential breakout opportunities based on the high and low points formed within the first 12 candles after the market opens on a 5-minute timeframe. It provides visual cues and labels to help traders make informed decisions.
Features:
Market Open High/Low: Marks the highest and lowest price of the first 12 candles following the market open with horizontal lines for reference.
Breakout Signals: Identifies potential buy or sell signals based on the first 5-minute candle closing above the open high or below the open low.
Target and Stop-Loss: Plots horizontal lines for target prices (100 points by default, adjustable) and stop-loss levels (100 points by default, adjustable) based on the entry price.
Visual Cues: Uses green triangles (up) for buy signals and red triangles (down) for sell signals.
Informative Labels: Displays labels with "Buy" or "Sell" text, target price, and stop-loss price next to the entry signals (optional).
Customization:
You can adjust the target and stop-loss point values using the provided inputs.
How to Use:
Add the script to your TradingView chart.
The indicator will automatically plot the open high, open low, potential entry signals, target levels, and stop-loss levels based on the first 12 candles after the market opens.
Use the signals and price levels in conjunction with your own trading strategy to make informed decisions.

Moving Averages + Premarket High/Low + Yesterday High/Low V2This script allows you to have multiple indicators on the chart at once. EMA's can be added to lower timeframes while SMA's can be added to higher timeframes. Premarket high and low are also tracked as well as yesterdays high and low. All these points are crucial in technical analysis as current price action can either bounce or reject off of these levels.
Update: Fixed an issue where high/low was showing for current trading day during market hours instead of previous trading day

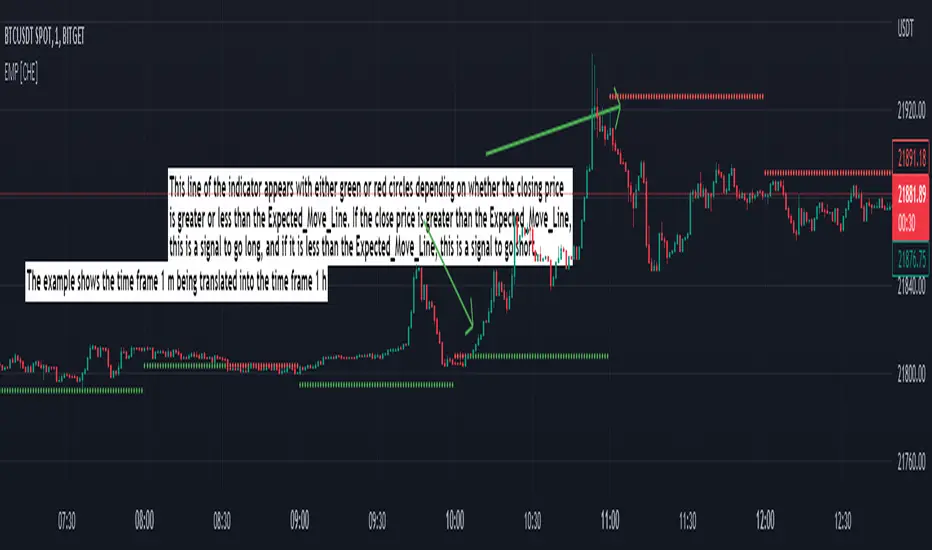
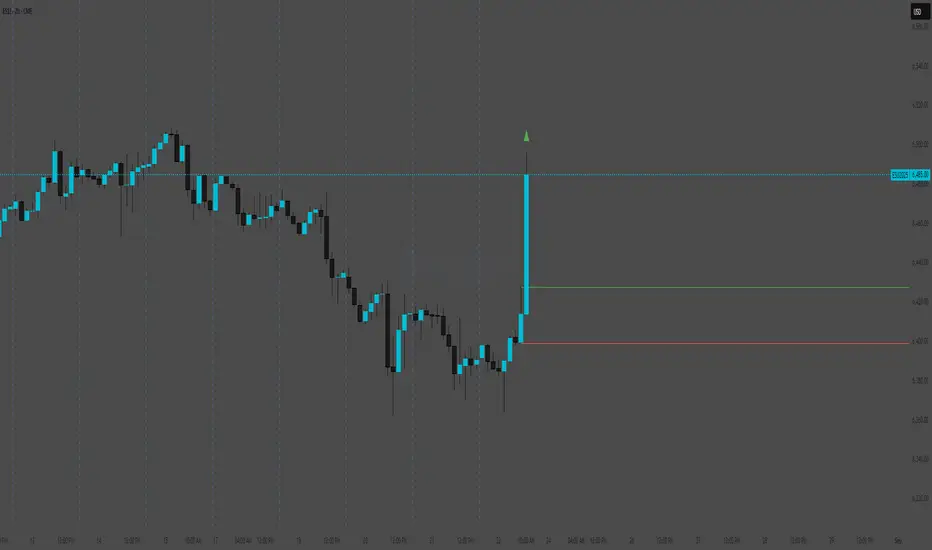
Expected Move Plotter [CHE]Expected Move Plotter
"There is magic in everything new."
Introduction:
This script is an indicator for financial trading that plots the expected movement of a security based on the average range over the last five periods. The script is written in Pine Script, a high-level programming language used for creating technical indicators, strategies, and other trading tools for the TradingView platform.
Inputs:
Percentage of Open and Close: This input specifies the percentage of the open and close price to use for the expected movement.
Time Periods: The script takes the different time periods into account and translates them to either 60 seconds, 240 seconds, 1 day, 3 days, 7 days, 1 month, 3 months or 12 months.
Calculation:
The script uses the "Open" and "High"/"Low" values of the last 5 periods to calculate the average range and plots the expected movement above and below the current open price. The plot is either green or red depending on whether the expected move is above or below the current close.
Code Breakdown:
The script starts by defining three integer constants: MS_IN_MIN, MS_IN_HOUR, and MS_IN_DAY, which represent the number of milliseconds in a minute, hour, and day, respectively.
The function timeStep_translate() returns a string that represents the timeframe for a chart based on the current timeframe. The function first converts the chart's timeframe to milliseconds and then uses a switch statement to determine the string value to be returned based on the number of milliseconds in the timeframe.
The script then retrieves the data for the open, high, and low values for the last five periods. The high and low values are used to calculate the average range, which is then used to plot the expected movement above and below the current open price.
Conclusion:
This script provides traders with a visual representation of the expected movement of a security based on the average range over the last five periods. It takes different time periods into account and provides a clear indication of whether the expected move is above or below the current close. The script is easy to use and provides a useful tool for traders looking to make informed trading decisions.
Best regards Chervolino
Multi TF High/Low/Open/Close LineNOTE: I'm not sure why the screengrab isn't showing the lines. They are there, and when I share the chart from this link they are there.... idk
This is a requested spin-off version of my previous HLOC for the Daily/Weekly/Monthly that allows users to choose 3 different timeframe units (Mins, Hours, Days, etc...) from the dropdown menu and then select the lookback period in which to draw the HLOC.
I've had quite a few requests to allow users to see multiple lookbacks for the same timeframe unit, mostly weekly, and I did not wish to change that particular script for that purpose. However, I was able to take the existing script and alter it for user input.
This indicator draws a line on the TF 1, TF 2, and TF 3 bar at the High, Low, Open and Close of user input Timeframe unit and selected lookback period.
The lookback period will go back the number of candles entered. So for example if you choose a 5 Min chart with a lookback of 3, the lines will be drawn on the HLOC 3 closed 5 min candles back. Selecting 0 will show data on the current Real-Time candle.
An example of a request I have gotten was for last week, the previous week and the previous month. The settings for that would be: TF 1 - 1 week Lookback 1, TF 2 - 1 week Lookback 2, TF 3 - 1 month Lookback 1.
Each set of lines has an optional identifying label with its own color set that can be shown with or without price value, and has drop down menus for size and style of each set of labels. The TF unit value is displayed on the label, but not the lookback.
So if you are using the hourly on all 3 TF's with different lookback periods, they will all say "60" on the label.
I recommend using the line and label options to distinguish between the different lookback values.
Each set of lines has inputs for line/text color, line width and style and each line argument can be selected independently.
In the chart example I have displayed only the High and Low on three 1 hour TF's with the lookback of 4, 5 and 6 candles with the labels descending in size. With this data I can see that over the last 6 hours the price of ES is in an descending pattern and I should be on alert for a break.
Since I trade ES in RTH on a much lower timeframe, this data can alert me to a bigger picture potential trend change or continuation. I would personally use this with pivot data for timing and look for entries in areas of high volume that moved price to a new
high or low that have not been retested.
I will be looking to add a user input offset for labels in the future. I have had bad luck with it in the past working for a couple weeks and then throwing an error, but I will look into it again soon.
I also recommend going into Chart Settings/Status Line and turning off indicator arguments OR moving the script to the top of the indicator list to avoid obstructed chart view with this indicators arguments. When script allows, I will update it to hide them.

Session High and Low IndicatorThis script is meant for stocks that have a pre-market session. It is meant to be used on the 1 min time frame. This script will draw a green line at the high of pre-market, and a red line at the low of pre-market and extend these lines across the regular session day
This makes it easy to see if price action during regular market has broken above pre-market high or broken below pre-market low.
The high/low skips any quick spikes in price action (similar to what happens at 8:30 am every day).

[TTI] Net New Highs / Lows––––History & Credit
There are multiple methodologies that use Net New Highs for the NASDAQ or NYSE as a market direction indicator. Recently, I saw Matt Caruso to also apply such methodology, so I decided to code this indicator.
–––––What it does
👉 Plots a Net Change histogram. This shows New Highs - New Lows, if the histogram is above 0 this means there are more highs than lows
👉 Plots Background colouring. This is dependant on the sensitivity setting of the indicator. We would require a few days of downward action before concluding a downward action. Sensitivity can be adjusted in the menu
👉 Bot the Histogram and the Background colouring can be turned on and off (as per screenshot example)
–––––How to use it
You can use it to validate if the market conditions are ripe for entering a trade. For instance if you trade long, you would want to confirm with the indicator that general market is facilitating moves to the upside. IBD have mentioned more than once that a stock move is 50% due to the general market move.

TPCharts HighOfWeekShows the days on which highs and lows for a week occurred (Sunday through Saturday).
Yeah, you could download data feeds and write some Python, but not everybody wants to do that.
Usage:
Get probability on your side when entering or taking profits.
If 60% of the weekly lows are on a Tuesday, what day probably works best to buy?
Keep in mind that many altcoins have slightly different weekly patterns.
Options in settings:
1. Show each day's name in a bubble underneath.
2. Display "summary" total stats for highs / lows when over 50 SMA.
Future updates:
Handle bear markets for final stats. Currently only calculates high/lows in summary bubble when over the 50 SMA.

Key Levels TheHuntThis indicator is made to show you some key levels on the chart on the different timeframes. You can hide them or show them in the settings. The levels are the Monthly Weekly and Daily opens, current monthly, weekly and daily high / low, last weeks high / low & last daily high / low as well as Monday high and low. These levels can be used as key pivots or key liquidity areas. You can also adjust the time to also use the correct Mon range for forex pairs.
As you can see on the chart, that is how the levels show up on the chart.

Currency Pairs High Low RangeIndicator gives the High-Low range of 18 currency pairs. There is a High Ave which is the average of the top four (you may need to adjust which ones are in the average) as well as the bottom four Low Ave. The picture is of a weekly chart with the indicator set at 12 week average of the High-Low range with a .7 (70%) multiplier. When I am looking for week long trades with lots of movement I pick my pairs based on the most actives with a 70% capture of the range as a guide line of when to exit. Sometime when I am not in the mood for volatility I go with the ones in the Low Ave area. Further, when I day trade I set the indicator to a 1Day chart and move the percent to 20% or 30% as a guideline to tell when to get out of a trade.

Weekend Asia High/Low Dots + Trading Window (UTC+1)**Weekend Asia High/Low Dots & Trading Window** is a lightweight TradingView indicator designed to **mark the exact Asia session extremes on weekends (Saturday & Sunday)** and highlight predefined **trading time windows** with maximum clarity and minimal chart clutter.
The indicator focuses on **precision, simplicity, and manual trading workflows**.
---
### 🔍 Key Features
#### 🟢 Asia Session High & Low (Weekend Only)
* Tracks the **Asia session on Saturday and Sunday**
* Marks **exactly two points per session**:
* One dot at the **true wick high**
* One dot at the **true wick low**
* Dots are plotted **only once**, at the **end of the Asia session**
* **No lines, no boxes, no extensions** – just clean reference points
* Ideal for traders who prefer to **draw their own ranges manually**
#### 🟩 Trading Window Highlight
* Customizable **trading time windows** for Saturday and Sunday
* Displayed as a **clean outline box** (no background fill)
* Helps visually separate **range formation** from **active trading hours**
---
### ⏰ Time Handling
* All session times are defined in **UTC+1**
* Uses a **fixed UTC+1 timezone** (`Etc/GMT-1`) for consistent behavior
* Easily adjustable to other timezones if needed
---
### ⚙️ Customizable Inputs
* Asia session times (Saturday & Sunday)
* Trading session times (Saturday & Sunday)
* Optional trading window labels
* Easy point size adjustment directly in the code
---
### 🎯 Use Cases
* Weekend trading (Crypto, Indices, Synthetic markets)
* Asia range analysis
* Manual range drawing & breakout planning
* Clean, distraction-free chart layouts
---
### 🧠 Who Is This Indicator For?
* Price action traders
* Range & session-based traders
* Traders who prefer **manual chart markup**
* Anyone trading **weekends with structured time windows**
---
### 🛠 Technical Details
* Pine Script® **Version 6**
* Overlay indicator
* Optimized for clarity and performance
---
If you want, I can also provide:
* a **short description** (1–2 lines for the TradingView header)
* **tags & keywords** for better discoverability
* or a **version with user-adjustable dot size via Inputs**

Daily High/Low/50%Daily High/Low/50% Levels Indicator
This Pine Script v6 indicator displays three horizontal lines from the previous daily candle:
High: The highest price of the last daily candle
Low: The lowest price of the last daily candle
50%: The midpoint between high and low
Key Features:
Lines extend from one daily candle to the next (Monday to Tuesday, Tuesday to Wednesday, etc.)
Fully customizable styling for each line independently:
Color selection
Line style (Solid, Dashed, Dotted)
Line width/thickness
Small labels ("H", "L", "50%") mark the start of each new day
Works on any timeframe (intraday charts show daily levels as reference)
Use Case:
Perfect for intraday traders who want to see the previous day's key levels as support/resistance zones. The 50% level often acts as a pivot point for price action.

Weekly Open + Monday High/Low (After Monday Close)b]Description
This indicator marks key weekly reference levels based on Monday’s price behavior.
It automatically detects each trading week and tracks:
• Weekly Open – the first traded price of the new week
• Monday High – the highest price reached on Monday
• Monday Low – the lowest price reached on Monday
Logic
The Monday range is fully captured only after Monday has closed .
No levels are plotted during Monday.
Starting from Tuesday, the indicator displays thin dots showing the completed Monday High, Monday Low, and Weekly Open for the remainder of the week.
When a new week begins, the indicator resets automatically and begins tracking the new week’s Monday.
Customization
The user can choose colors for:
• Monday High/Low
• Weekly Open
Purpose
This indicator helps traders visualize weekly structure, monitor weekly opening levels, and quickly identify Monday’s range for weekly bias analysis or strategy development.
It can also be used to manually backtest Monday range strategies .

Previous Candle High/Low (Global Rays)Previous Candle High/Low (Global Rays, Corrected)
This indicator tracks the high and low of the most recently closed candle and projects them forward as global horizontal rays.
Features:
✅ Automatically updates the levels once a candle fully closes.
✅ Draws persistent lines at the previous candle’s high (green) and low (red), extending them into the future.
✅ Highlights real-time breakouts:
✅ Includes built-in alert conditions for both breakout events.
How to Use:
Use the levels as reference points for breakout trades, liquidity sweeps, or stop hunts.
Alerts can help you catch moves without needing to constantly watch the chart.
Works on any timeframe and symbol.
PDH/PDL (prev RTH) + Current ETH High/LowDescription:
This indicator automatically plots the key levels of PDH/PDL (Previous Day High/Low from regular trading hours – RTH) and ETH High/Low (Extended Hours: pre-market + after-hours) in real time.
• PDH/PDL: calculated at the close of RTH (09:30–16:00 NYSE) and anchored until the next day.
• ETH High/Low: updated live during extended hours (04:00–09:29 and 16:00–20:00 NYSE) and “frozen” at the RTH open for reference during the regular session.
• Customization options: colors, line styles (solid/dashed/dotted), thickness, labels, and the ability to extend lines to the right.
• Levels can also be displayed directly on the price scale.
This script is designed for traders who want a quick visualization of the most relevant levels from the previous day and extended hours, making it easier to identify supports, resistances, and potential reaction zones in price action.
By: Miguel Arenas

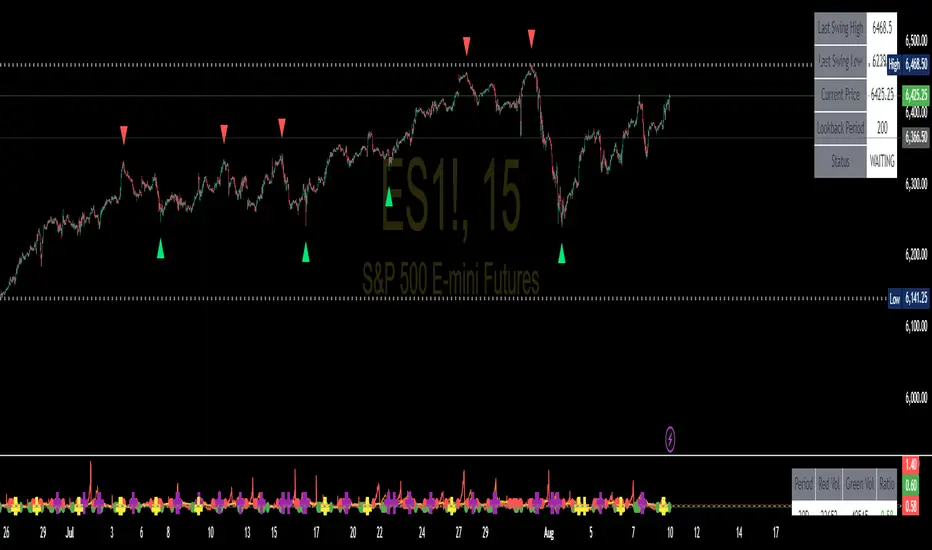
Swing High/Low SignalsSwing High/Low Signals – profit gang
Quickly spot recent market turning points with this clean swing high/low indicator.
Marks swing highs & lows with labels or triangles
Optional connecting lines & background highlights
Alerts when new swings form
Info table showing last swing levels & current price
Fully adjustable lookback period for any timeframe.
Disclaimer: For educational use only. Not financial advice.
Pro Maker Prev Month Wick High/LowThis indicator plots the exact Previous Month’s Wick High & Wick Low on the chart.
Levels are fixed across all timeframes (M1 to M).
High/Low lines start exactly from the first bar of the previous month and extend to the right.
Perfect for identifying important swing points and supply/demand zones.
Features:
Auto-updates at the start of a new month.
Works on any symbol & any timeframe.
Clean dotted-line visuals with color-coded High (Red) & Low (Green).
Use case:
Quickly see where the previous month’s extreme levels were.
Combine with price action or breakout strategies for higher accuracy.